Networks
This lesson introduces the mathematical structure of networks/graphs,
and explores a disease model using networks. We continue to practice
making claims using evidence from models, but now we also consider
how different models can give us different perspectives on a phenomenon.
Networks
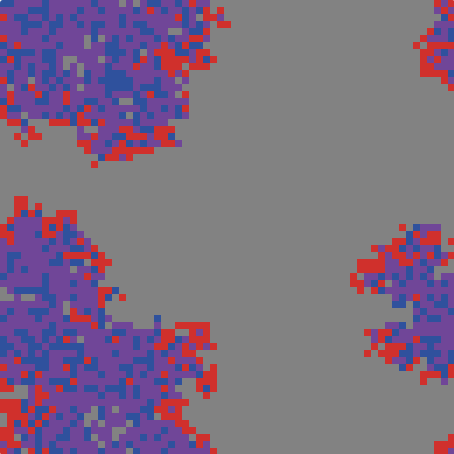
Put the two images below up on the screen. Remind students that the grid on the
left shows the disease model we have been working with in the past two lessons.
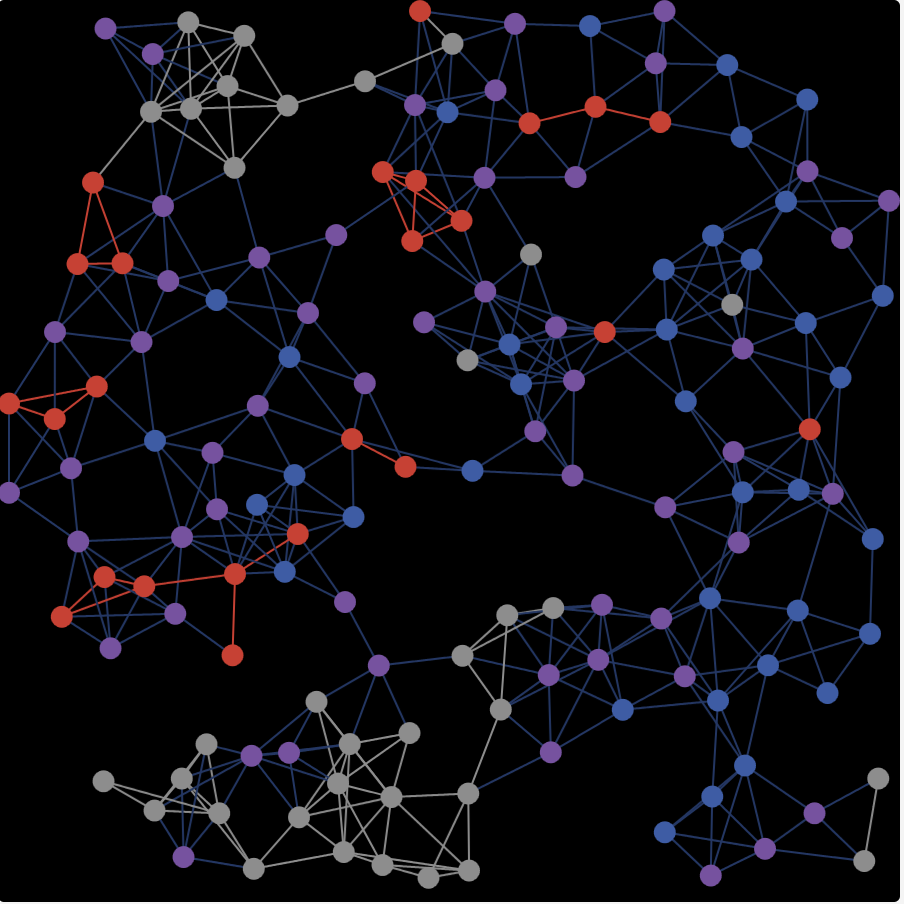
The network on the right is new.
Ask students to discuss in small groups: Assuming the colors have the same meanings
(gray is susceptible, red is infected, blue is recovered/resistant, and violet
is dead), how can we make sense of the network?
A few observations and questions that might come out:
In the grid, each square represents a person. In the network, each circle represents a person.
In the grid, disease spread to neighbors (including diagonals). In the network, disease
spreads along the lines
We understand why the circles are colored grey/red/blue/violet, but why are the lines between
them colored too?
Can we think of the grid as a network too?
Don't worry about the official graph terminology introduced below--use whatever language
students find effective.
Today we are going to work with a different kind of disease model, a network.
(Mathematicians call networks graphs --either is fine. We will generally use the term network because
graph can also refer to a chart.)
Networks have nodes
Networks also have edges
A node's degree neighbors
Network-based disease model
Demonstrate how the network disease model works by creating a tiny network, with
10 nodes, average node degree 3, and outbreaks set to 1. (An example is shown in the
figure below.) First examine the static properties of the network:
List out the degree of each node. Confirm that the average node degree is 3 by adding up
each node's degree and dividing by the number of nodes.
Click setup a few times. Note that the degree distribution changes, but the average degree
remains the same.
Occasionally, you will get a network which is not connected
Now use the "step" button to move forward one tick at a time. Notice together how the disease spreads
to neighbors. What is the meaning of the edge colors?
After this introduction, ask students to play with the network simulation and discuss what they are seeing
in small groups. After a while, bring the class back together and create three lists:
Things we noticed.
Questions we have.
Claims we make.
⚡✨ Deliverables
Answer the following questions about networks:
If a network has four nodes and is fully-connected
Now consider fully-connected networks with different numbers of nodes. Complete the table below.number of nodes node degree number of edges
2 3 4 5 6 7 8
How many edges would there be in a fully-connected network with 100 nodes? Explain your reasoning.
The distance diameter
We can think of the spatial disease model from previous lessons as a network too. What are the nodes? What are the edges? What is the average node degree?
Answer each of the following questions about the network disease model.
Describe an emergent phenomenon you noticed in the network model. Use a screenshot of the
network and/or the population health plot to illustrate the phenomenon.
How does the average node degree affect the percentage of people who end up dying? Give several
examples from different runs of the model. Explain how we could interpret this in real-life
disease scenarios.
Choose a claim about how disesases work in the network model. Support the claim with evidence
from the model.